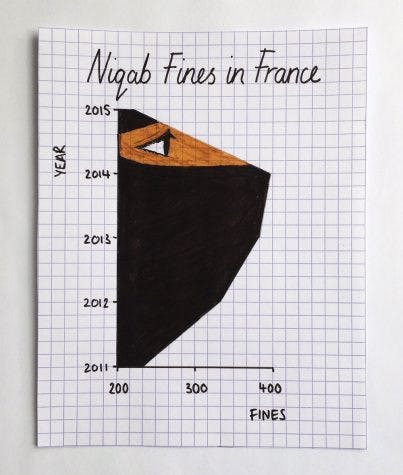
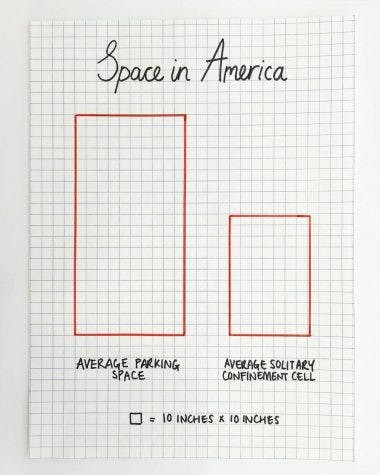
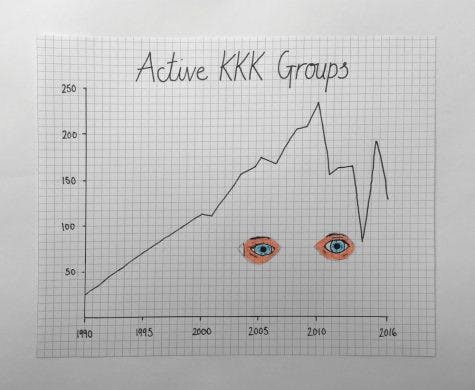
Pubic hair grooming injuries, the KKK, pantyhose sales, affirmative action, left-handed people, the wage gap, cervical dilation, nepotism, third nipples, the Red Fox population, pizza, the niqab, flu viruses, nose jobs and the probability that your pet will die on a plane: these are all topics that Mona Chalabi, data editor for The Guardian U.S., discussed during the Women’s History Month lecture on March 19 in the President’s Dining Room.
Chalabi’s presentation, titled “Taking the ‘Numb’ Out of Numbers,” focused on her work illustrating and animating data in an effective and interesting, yet indisputable, way.
She said that while data is impossible to deny, it is easily manipulated by individuals with specific agendas. She has spent her career using data visualization to make information accessible and impactful so that anyone can question what they see and make their own decisions about the subject.

Chalabi’s work with images comes from her understanding that statistics often go overlooked or fail to have sufficient impact on the reader in a time when there are abundant social problems that demand public attention.
“There’s something about charts that I think means that people don’t necessarily question them,” Chalabi said. “I want people to learn some (skepticism) about charting. The data that’s underneath it that’s very often emphasized, it’s imperfect and humans have made decisions about how to collect it and present it.”
She said while her charts present reliable data, she chooses to include imagery of the subject to elicit emotion in consumers.
“There’s a bit of an activist in me as well as a journalist,” Chalabi said.
Chalabi spoke about the intersection of politics and journalism in regards to journalists facing the same level of distrust as politicians.

Because of the disconnect between the journalists, Chalabi said it is important to show every step of her process in creating her work. Journalists, she said, are meant to be the informants of the people and citizens who need to make political decisions for themselves.
“There needs to be more ways for us to share our process with the audience so that they can understand how we reach our conclusions,” she said.
Chalabi presented sources where she frequently finds data and showed a video she shared on her Instagram story demonstrating her entire process, including each and every step she took in designing and creating a piece.
To Chalabi, increasing transparency also involves receiving and responding to readers’ feedback about her work, especially regarding social justice data and the representation of marginalized groups.
She said some examples include asking her audience what topics they want her to cover or asks them to choose which of several visualizations she has made makes more sense to them.

Chalabi said she was open about “messing up” in her visualizations. She mentioned a time when some of her followers pointed out to her that she wrote “Hindu” instead of “Hindi” on a visualization which represented languages spoken by a specific community.
She said her response was to take down the art and re-publish an updated version of the piece with an explanation to her audience of what happened.
Mercer freshman Zaira Khan, who attended the lecture, said that she has noticed people on every side of an issue miscommunicate data and that Chalabi’s method of presenting facts should be the norm in politics and activism.
“I think the way that she discussed data analysis in relation to issues is the direction that social justice needs to head towards, and fast,” Khan said.
Aside from her work with The Guardian, Chalabi has analyzed data for the International Organization for Migration, Transparency International and the Bank of England.
After moving to the United States, Chalabi wrote for FiveThirtyEight, a site based on poll analysis and politics, and ran a radio show for the American National Public Radio called “The Number of the Week.”
She has written TV shows for the BBC, National Geographic and VICE and helped create “Vagina Monologues,” a video and interactive-based series through The Guardian that provides sexual education, especially through the lens of women and the LGBTQ+ community.
Mona Chalabi delivers Women’s History Month lecture at Mercer

Mona Chalabi speaking at a symposium at FH Joanneum in December 2013.


